Featured Projects
Medicare Analysis Pipeline
A four-part connected pipeline analyzing 9.66 million CMS Medicare Part B records, covering raw data ingestion through billing behavior, geographic equity, and anomaly detection. Every tool in the stack works together on one real-world problem.
Data Pipeline & Quality Framework

Built a PostgreSQL pipeline ingesting 9.66M Medicare service records and running 22 structured quality checks: validating payment logic, catching null and zero values, confirming CMS suppression compliance, and flagging geographic inconsistencies. Every finding in Parts 2–4 depends on the decisions made here.
View ProjectBilling Behavior Analysis

Every procedure has a Medicare-approved price, but providers can bill above it with no ceiling. This project analyzes 9.66 million 2023 billing records to test whether the 2022 No Surprises Act curbed that markup and whether drug pricing or provider behavior is really driving it.
Geographic Equity Analysis

Medicare adjusts pay by location through the GPCI, paying more in expensive cities and less in rural areas — in theory, to close the rural-urban pay gap. Using 2023 Part B data, this project finds the opposite: GPCI redistributes payment toward urban providers rather than closing the gap.
Anomaly Detection

With 1.17M providers in the dataset, this project uses z-scores and coefficient of variation to flag outlier providers and inconsistent procedure pricing — distinguishing specialty-wide norms from individual outliers, since each needs a different response.
Other Projects
Six standalone projects across five tools: SQL, Python, Tableau, Power BI, and Excel. The Medicare series above is where they all come together.
Contoso Customer Analysis

Which customers are valuable, at-risk, or already gone? This project uses PostgreSQL to analyze 10 years of e-commerce data across 74 store locations, building percentile-based value segments, a cohort revenue model, and a retention analysis flagging at-risk and churned customers by purchase recency.
View ProjectCustomer Analysis Dashboards
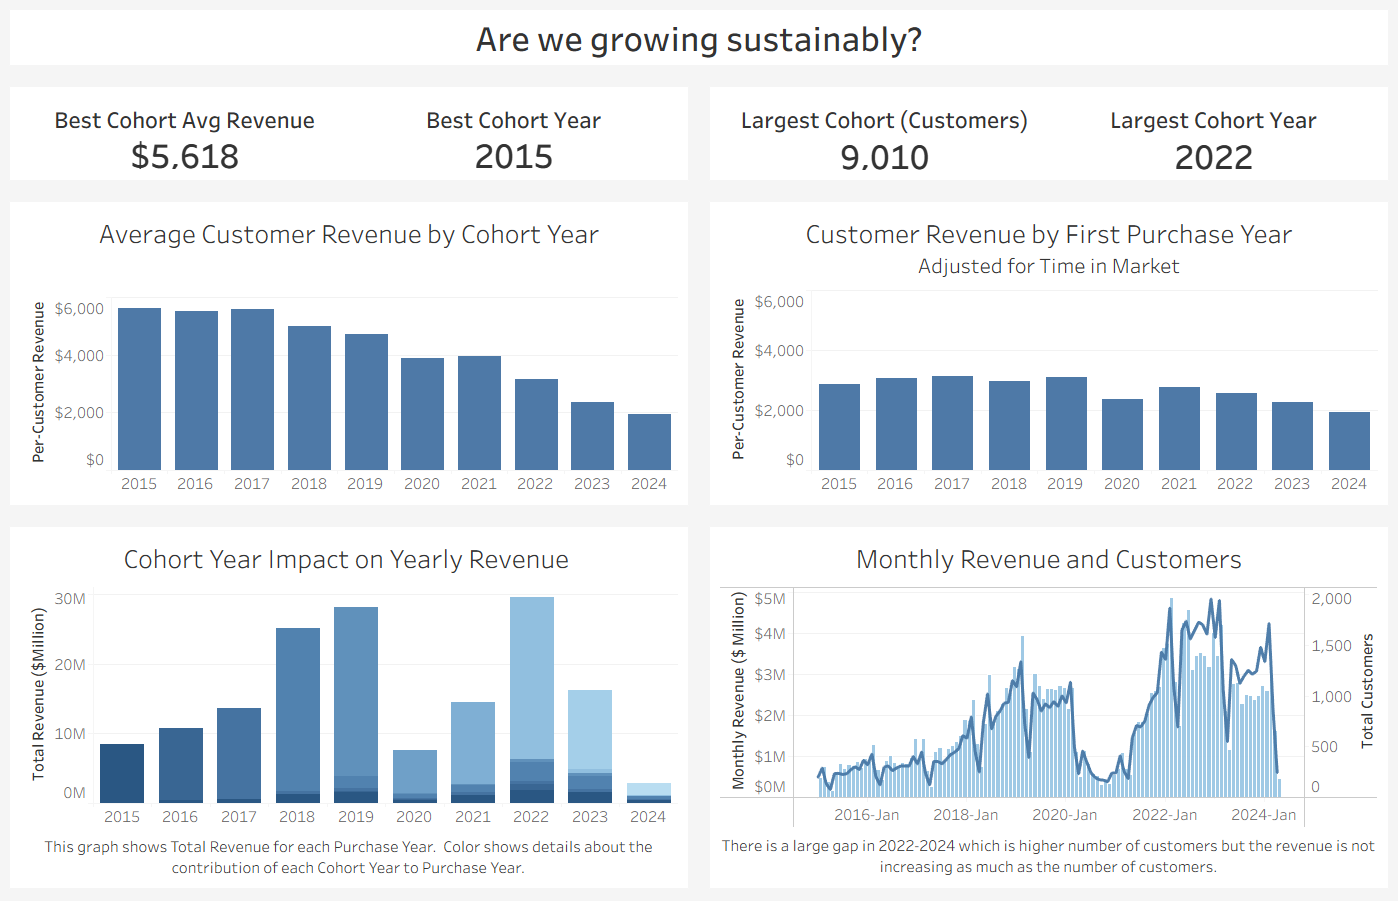
Visualizes the same Contoso e-commerce customer data as three interactive Tableau dashboards covering value segmentation, cohort performance, and churn risk — each with drill-down filtering and LOD expressions, plus a prioritized win-back list for re-engagement campaigns.
View ProjectData Jobs Dashboard
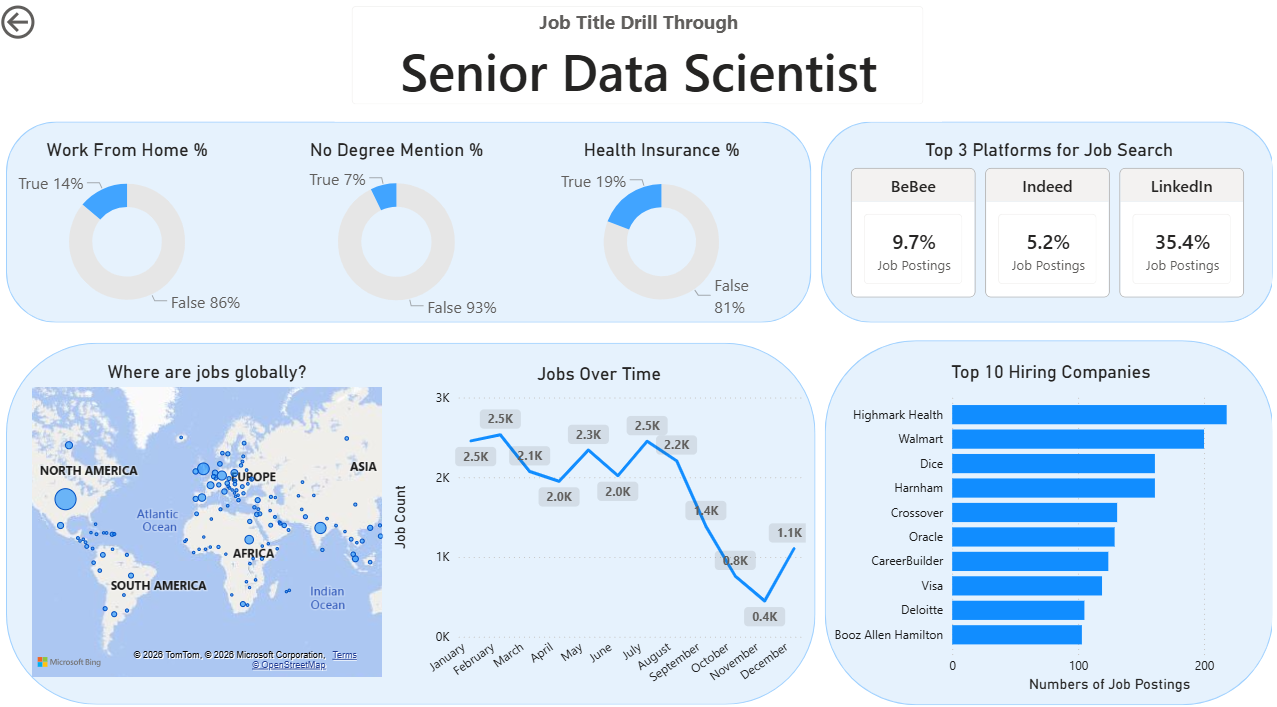
An interactive Power BI report exploring the 2024 data job market across 478,895 postings, built for job seekers weighing where to focus their skills and what to expect in pay. Uses a 4-table star schema and DAX measures, with slicers for job title and country to compare skill demand and salary by role.
View ProjectData Jobs Market Analysis
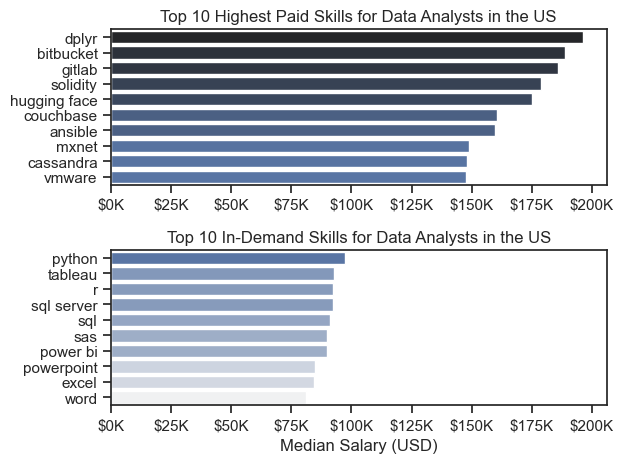
A structured exploratory analysis of the data job market, covering salary distributions, skill demand frequency, and hiring trends by role and location — using Pandas, Matplotlib, and Seaborn across five Jupyter notebooks to explore the job landscape and optimal skill combinations.
View ProjectSalary Dashboard
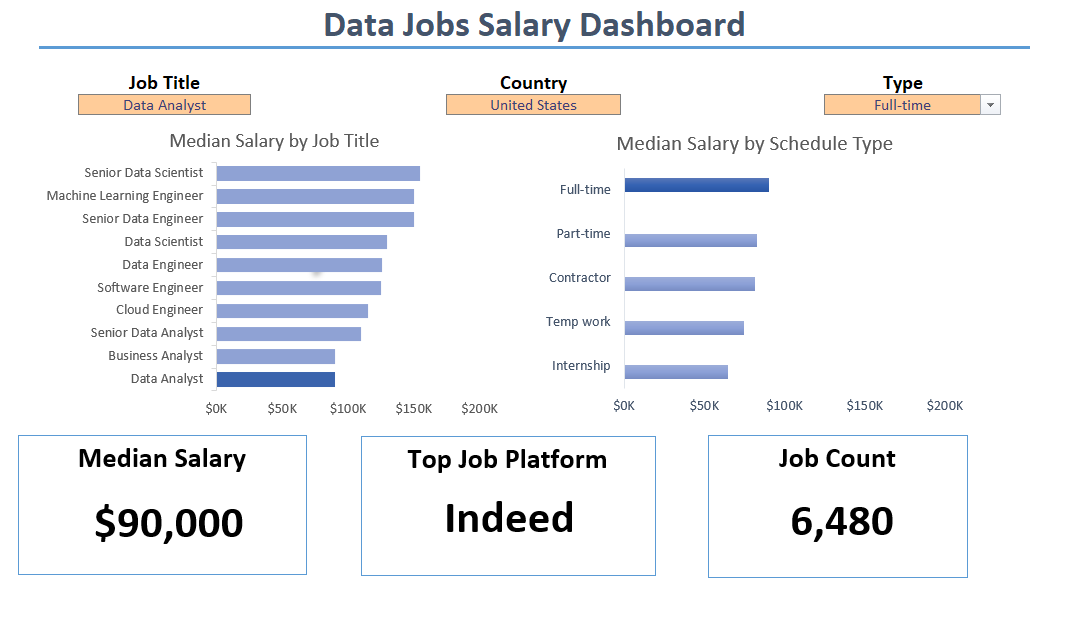
An interactive Excel dashboard for exploring salary ranges across 32,672 job postings in 111 countries, with three synced dropdown slicers driven by MEDIAN(IF) array formulas (no VBA). Shows how pay for the same role varies by country.
View ProjectSkills and Pay Analysis
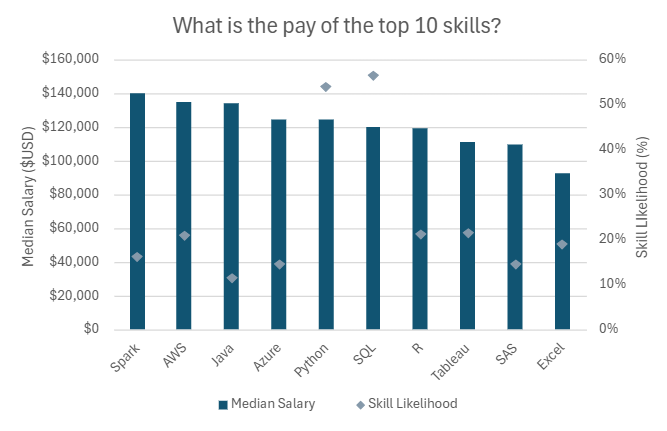
Builds on the Excel salary dashboard to investigate what actually drives pay differences. Using Power Query, Power Pivot, and DAX, it examines skill demand, skill-pay correlation, regional gaps, and top-paying skill combinations, completing the market picture the salary dashboard illustrated.
View ProjectAbout Me
I am a Vancouver-based data analyst with a background in financial reporting and operational data across multi-entity business environments.
My accounting work built analytical instincts that transfer directly to data work: constructing consolidated financial statements across five entities, reconciling transaction data from third-party platforms, and using SQL-extracted data to model performance trends and support operational decisions. I understand what business stakeholders need from data before they can act on it.
My technical stack covers the full analytical workflow: PostgreSQL for data modeling and querying, Python for analysis and visualization, Tableau and Power BI for interactive reporting, and Excel for financial modeling and dashboard work. My projects range from standalone, tool-specific builds to a four-part integrated analysis of a CMS Medicare dataset, applying data quality checks, statistical methods, and geographic analysis to uncover patterns in provider billing behavior.
Get in Touch
Interested in working together or want to discuss the projects? I would love to hear from you.